Act I
Noise
Studies reach us every day.
We only ever see them from the front.
Act II
The headline
Spring 2015. Front page.
Science says so.
Act III
The facade
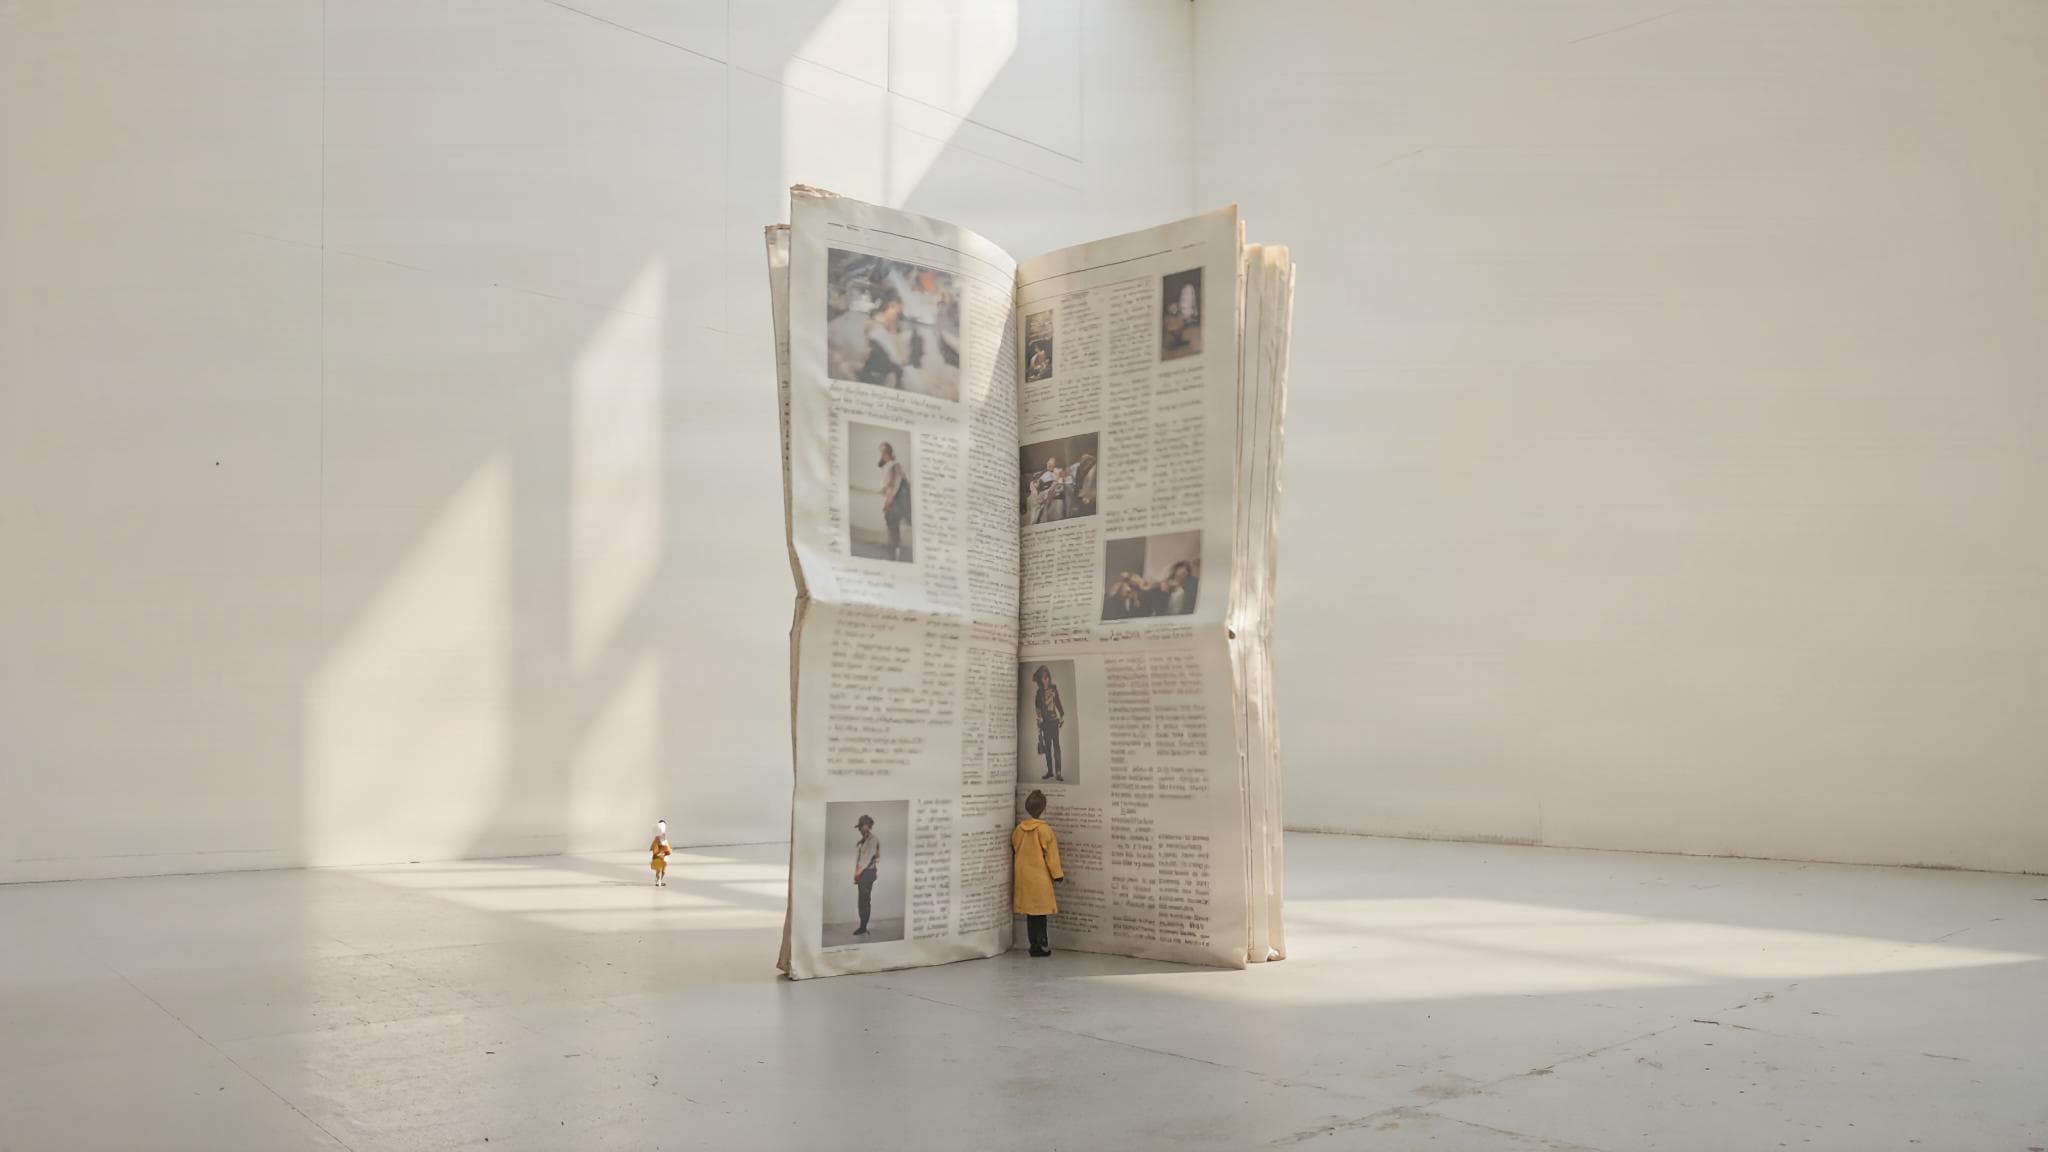
From the side, it is one sheet of paper.
Behind it: 15 people, 18 measurements.
Weight slipped under 0.05. That was enough.
Act IV
The smoke detector
A hundred studies. The effect is real in every one.
Only what breaks through the wall counts as a finding.
Act V
Telephone
A finding in mice, on its way to your feed.
When the press release overstated, 86% of articles followed. Otherwise, 10%.
Act VI
Run it again
97 significant results.
Run them again: 35 hold.
Finale
The candle
Extraordinary claims require extraordinary evidence.
Carl Sagan made the line famous. Below: the evidence.
At the end of March 2015 an “Institute of Diet and Health” sent out a press release. People on a low-carb diet who ate a bar of dark chocolate a day, it said, lost weight faster. The study had appeared in the International Archives of Medicine; lead author, Dr Johannes Bohannon. Days later it was on the front page of Bild, Germany's biggest tabloid, then in the Daily Star, the Times of India, Cosmopolitan and the Huffington Post.
There was no institute. Johannes Bohannon is John Bohannon, a science journalist, and he had built the study with the filmmakers Peter Onneken and Diana Löbl for a documentary, “Schlank durch Schokolade”, broadcast on arte and ZDF in June 2015. The trial itself was real, which is the uncomfortable part. Sixteen people signed up, one dropped out. Eighteen things were measured, from weight and cholesterol to sleep quality. The journal took the paper for about 600 euros. Bohannon spelled out the recipe afterwards: measure that many things in that few people and you have roughly a 60 per cent chance that something comes out “significant” by luck alone.
Nobody faked a number. It took a tiny study, a long list of measurements, a press release with a hook and newsrooms that did not ask the obvious questions. The case is extreme, built as a trap. Every part of the mechanism is ordinary.
Which treatment works, which diet harms, which policy pays off: most of what we decide rests on research we did not do and cannot check. What reaches us is the headline. This piece is about two men who built tools for reading past it, the psychologist and statistician Jacob Cohen and the astronomer Carl Sagan. They read along in the margin, like referees on a manuscript. Their notes are our sharpened paraphrase, never a quotation.
15
participants
18
measurements
600 €
fee to get published
The headline is bigger than the study.
Concept image, AI-generated with Bria
The silent alarm
Shortly after the Second World War, Cohen later recalled, a fellow doctoral student set out to show what small samples could do. He used “a sample of only 20 cases per group”, found nothing significant and announced that an important branch of psychoanalytic theory had been refuted. His arithmetic was correct. What it proved was that his study was too small.
Only years later did Cohen ask what nobody had asked: if the effect was real, how likely was this study to find it? That probability is called statistical power. With 20 per group and a medium-sized effect, it was 33 per cent. Even with 30 per group it would have been 47 per cent, “approximately a coin flip”. The experiment would most likely have missed the effect had it existed. As a refutation it was worthless.
Cohen then checked whether this was a one-off. He went through the 1960 volume of the Journal of Abnormal and Social Psychology, 70 articles with the relevant tests, and asked of each: if the effects exist, how well could this study see them? For small effects the average chance was 18 per cent. For medium ones, 48. Only for large effects did it reach 83.
Picture a smoke detector that only goes off once the curtains are on fire. If it stays quiet while smoke fills the room, you do not conclude that the air is clean. You check the detector. With studies we draw that conclusion all the time: “no significant effect” gets read as “no effect”.
Try it. In the next graphic the treatment works in every one of a hundred studies. You only decide how many people each study gets.
A hundred studies, one real effect
Each dot is one study. In all hundred, the treatment really works. You only change how many people each study gets.
Cohen's fellow student: 20 per group. Two in three studies report “no effect”. It is there in every one.
difference in standard deviations (Cohen's d)
33 / 100
studies sound the alarm
The rest report “no effect found”.
d = 0.85
is what the hits report on average
The true effect is d = 0.5. Read only the hits and you overestimate it.
Now watch the second number on the right. In small studies only the lucky upward outliers clear the line. Read only the significant results and you read inflated effects, systematically. Keep that in mind for the power pose.
Did anyone listen? Twenty-four years later Peter Sedlmeier and Gerd Gigerenzer repeated Cohen's survey. Median power for a medium effect had fallen, from 0.46 to 0.37. Two of 64 experiments mentioned power at all. In 2013 a team led by Katherine Button put median power in neuroscience at 21 per cent, across 730 studies.
How big is big
Then as now, most readers look at one number: is p below 0.05? If so, the result is “significant”. The word sounds like “important”. It means something far smaller: data this surprising would be unlikely if there were no difference at all. It says nothing about how big the difference is.
Take an invented sleep app, tested on 100,000 people. With that many, you can show beyond reasonable doubt that it lengthens sleep by a minute and a half a night. Real, significant, and probably not worth your money or your data. Turn it round: a small pilot in which an intervention adds half an hour of sleep can miss the threshold because too few people took part. Promising and unproven at once.
Cohen called the size of a difference the effect size. For two groups he proposed the measure that now carries his name: Cohen's d, the difference in standard deviations. Around 0.2 he called small, 0.5 medium, 0.8 large. The labels conquered psychology, education and medicine. Cohen trusted them less than most of the people who cite him. Setting such cut-offs, he wrote, is “an operation fraught with many dangers”; anyone who knew their field should judge for themselves.
He was right. A treatment that saves ten more of every hundred seriously ill patients can rate as “small” on a standardised scale. A tiny edge that compounds over ten years can matter enormously; a big one that fades after three weeks, hardly at all. Those are no longer statistical questions. They are questions of what we value.
For a reader, the job is to translate the number back into the world. How many minutes, kilos, euros, symptoms, lives? Did a risk fall from 40 to 20 per cent, or from two in 10,000 to one? Both get reported as “halved”. Since 2012 the statisticians behind the “Unstatistik des Monats”, now Thomas Bauer, Gerd Gigerenzer, Walter Krämer and Katharina Schüller, have taken one such number apart every month. They have not run out.
Eighteen lottery tickets
Cohen's cure for weak studies was simple: decide in advance what you are looking for. Power depends on four quantities: the size of the effect, the number of observations, the threshold for a false alarm and the chance of a hit you want. Fix three and the fourth follows. If you know which effect matters in practice, you can work out how many people you need before you recruit the first. For a medium effect and an 80 per cent chance of a hit, that is 64 per group. For a small one, nearly 400.
The reverse has a name now: p-hacking. Measure first, then see what turns up. It needs no fraud. Measure many things and report the one that works. Peek at the data after every ten participants and stop when it looks good. Keep the outliers once, drop them the next time.
That is how the chocolate study worked. It could never have shown whether chocolate helps you lose weight. It only had to buy enough tickets: among 18 measurements, something was likely to fall below 0.05 by chance. The next graphic, the one paper-white break on this page, puts you in Bohannon's lab.
Your study
15 people, three weeks, 18 measurements. Here the chocolate does nothing; every value is pure chance. Whatever slips under the line anyway becomes the headline.
Tomorrow's paper
Study: Chocolate lowers cholesterol
Cholesterol, p = 0.039
100%
1 study, 1 with a headline
Expected: 1 − 0.95¹⁸ ≈ 60 per cent
| Measurement | p value |
|---|---|
| Weight | 0.720 |
| Cholesterol | 0.039 significant |
| Blood pressure | 0.456 |
| Sleep quality | 0.075 |
| Well-being | 0.763 |
| Sodium | 0.481 |
| Blood sugar | 0.487 |
| Resting pulse | 0.162 |
| Waist | 0.263 |
| Blood protein | 0.553 |
| Mood | 0.195 |
| Cravings | 0.084 |
| Concentration | 0.714 |
| Triglycerides | 0.477 |
| HDL | 0.794 |
| Inflammation | 0.880 |
| Morning energy | 0.324 |
| Skin | 0.691 |
In 2011 Joseph Simmons, Leif Nelson and Uri Simonsohn showed how far this goes. They played 20 students either an instrumental track or the Beatles' “When I'm Sixty-Four”. Afterwards the Beatles group was nearly a year and a half younger, by date of birth, at p = 0.040. The result is impossible, which was the point. They got there by controlling for the fathers' age, leaving other measures unreported and checking the data after roughly every ten participants. Each of those moves is routine in research. In their simulation, four such freedoms combined pushed the rate of false hits to 61 per cent.
Telephone
So much for the researchers. Between a study and your breakfast table sit at least two more stops: the press office and the newsroom. In 2014 a team led by Petroc Sumner traced where the exaggeration creeps in. They compared 462 press releases from British universities with the studies behind them and with the 668 news stories they produced.
The journalists are only partly off the hook. Forty per cent of the releases gave more sweeping advice than the study did. A third turned a correlation into a cause. Over a third took findings in animals or cells and applied them to humans. Whatever the release inflated, the news mostly inflated too. Where the release already made the unwarranted leap to humans, 86 per cent of the articles made it. Where it did not, 10 per cent did.
The sting is in a detail. Exaggerated releases were not picked up noticeably more often than careful ones. The hype bought no extra coverage, only less truth. Social media runs on different rules: an analysis of eleven years of Twitter found in 2018 that false stories were 70 per cent more likely to be retweeted than true ones.
It has not stopped. Last year a study in Nature Medicine reported so much microplastic in human brains that headlines spoke of a spoonful. In December 2025 Germany's Federal Institute for Risk Assessment pushed back: the amounts were “implausibly high”, contamination could not be ruled out, and nothing in the study showed a causal link to dementia. Then duplicated images turned up in the paper. In May it was a working paper from Cincinnati blaming smartphones for falling birth rates. The Unstatistik pointed out that the link held only for teenagers. Among women over 25, who account for about 80 per cent of births, there was none.

42
participants in 2010
200
participants in 2015
none
effect on hormones
The pose went round the world. The replication stayed home.
Concept image, AI-generated with Bria
Two minutes, 77 million views
The most successful story of the genre starts in 2010 with 42 people. Dana Carney, Amy Cuddy and Andy Yap had them stand for two minutes, feet apart, hands on hips, in a “power pose”, or sit hunched. Afterwards, the study reported, the posers' testosterone was up, their stress hormone cortisol down, and they were readier to gamble.
Cuddy's 2012 TED talk on it has more than 77 million views on ted.com. The pose made it into interview guides, leadership seminars and changing rooms.
In 2015 a team led by Eva Ranehill ran the experiment again with 200 people. No effect on hormones, none on behaviour. Only the feeling of power rose slightly. A year later Carney, the first author, did something rare in psychology and put it in writing: “I do not believe that ‘power pose’ effects are real.” The sample had been tiny, the analysis flexible. Cuddy stands by the effect on feelings, and that is a fair debate. On the hormones there is little left to argue about.
Remember the second number in the smoke-detector graphic? A study of 42 people that finds an effect almost inevitably finds one that is too big. That takes no misconduct, only arithmetic.
Run it again
The Open Science Collaboration set out to measure how common this is. 270 researchers repeated 100 studies from three leading psychology journals of 2008, as faithfully as they could and mostly with larger samples. 97 per cent of the originals had reported significant results. Of the replications, 36 per cent did. The average effect shrank by half.
average effect
97
significant the first time
35
the second time too
of the 97, about 36 per cent
That does not mean 64 per cent of psychology is wrong. The authors themselves warn that no single criterion settles whether a finding held, and that originals and replications can differ in many ways. The pattern is still hard to miss: much of what looked certain looks shakier once someone checks with more people.
Part of the explanation is what never gets printed. Annie Franco, Neil Malhotra and Gabor Simonovits followed 221 social-science studies whose designs were known in advance. Studies with strong results were 40 percentage points more likely to be published, and 60 points more likely to be written up at all. Most null results stayed in the drawer. What we read is a highlights reel. In 2005 the statistician John Ioannidis gave the problem a deliberately provocative title: “Why most published research findings are false”. It is a model, not a measurement, but its ingredients are exactly these: small studies, small effects, a lot of leeway.
Below that lies a darker layer. Brian Wansink, once the star of food research at Cornell, boasted in a 2016 blog post about a doctoral student who “never said no” and squeezed several papers out of a failed data set. Other researchers started reading his work closely. According to the Retraction Watch database, 17 of his papers have now been retracted (as of October 2026); in September 2018 he announced his resignation. In 2025 Harvard revoked the tenure of the behavioural scientist Francesca Gino after the blog Data Colada had flagged anomalies in data from her studies. She denies misconduct and is suing the university. And paper mills now manufacture journal articles to order. The publisher Hindawi alone retracted more than 8,000 of them in 2023. An analysis in PNAS estimates that their output doubles every year and a half. The scientific literature as a whole doubles every 15 years.
In fairness, psychology has done more with its crisis than most fields. Many studies are now registered in advance, with hypothesis, sample size and analysis fixed. Some journals accept papers before the results are in and publish them however they turn out. Replications earn credit again. Data Colada, Retraction Watch and the Unstatistik are science too. The system corrects itself. It is just slower than the headline.
The dragon in the garage
In 1995 Carl Sagan published one of his last books, “The Demon-Haunted World: Science as a Candle in the Dark”. He died in December 1996. The German edition appeared in 1997 as “Der Drache in meiner Garage” (The Dragon in My Garage), named after the book's best-known episode.
Someone tells you a fire-breathing dragon lives in their garage. You want to see it. It is invisible. You scatter flour to catch its footprints. It floats. You measure the heat of its breath. The fire is cold. Every test meets an excuse. Sagan's question: what is the difference between a dragon that escapes every test and no dragon at all? A claim that cannot be tested is worth nothing, however earnestly it is made.
The core of the book is a chapter on “the fine art of baloney detection”, a toolkit scientists use every day. Seek independent confirmation. Let knowledgeable people from different camps argue it out. Do not mistake authority for proof. Try several explanations and do not fall in love with your own. Quantify where you can. Check every link in a chain of argument. Prefer the simpler explanation. And ask whether the claim could be disproved at all.
Then comes a list of common fallacies, and parts of it read as if Sagan had Cohen's papers open beside him. The “statistics of small numbers”. Observational selection, counting the hits and forgetting the misses. Confusing correlation with cause. Suppressed evidence and half-truths. And the famous line, which Sagan did not coin but made famous: extraordinary claims require extraordinary evidence. Laplace had the idea in the early 19th century, the sociologist Marcello Truzzi shortly before Sagan.
A paper from 1998 shows what it costs to ignore the toolkit. In the Lancet, Andrew Wakefield linked the measles, mumps and rubella vaccine to autism on the strength of twelve children. Twelve children, no control group, an extraordinary claim. The Lancet fully retracted the paper in 2010; the same year Wakefield was struck off the medical register. In 2019 a Danish study of 657,461 children found no link. The fear has outlived the paper.
Sagan feared for more than single studies. In a much-quoted passage he pictures an America whose industries have moved abroad, where enormous technological power sits with a very few and the public can no longer judge for itself what it is told: a country that cannot tell what feels good from what is true. The passage went viral in 2017. He wrote it more than twenty years earlier.

Confirmed?
by others, independently
Testable?
could it be disproved
How big?
in real units
Enough light for the next step.
Concept image, AI-generated with Bria
Sagan does not ask you to distrust everything. Cynicism is as comfortable as credulity; both spare you the thinking. Science, for him, is a habit that holds two things at once: openness to new ideas and ruthless scrutiny of each one. He called it a candle in the dark. It does not light everything. It lights the next step.
Six questions
In 1994, four years before his death, Jacob Cohen published an essay with a deliberately absurd title: “The earth is round (p < .05)”. Its target was a ritual. Compute p, compare it with 0.05; below the line the effect is real, above it there is nothing. Two near-identical studies at p = 0.049 and p = 0.051 land on opposite sides, although their evidence is all but the same. A p value is not the probability that a hypothesis is true. It is one tool, and Cohen wanted the others used as well: effect sizes, confidence intervals, replication, judgement.
Cohen's questions and Sagan's tools add up to a checklist for any “according to a study” story. You need no statistics software for it. You need to accept the answer when you do not like it.
The checklist
Six questions, three findings that went round the world. Pick one.
2015, through papers in several countries
Cohen
Could the study have found the effect at all?
failed. 15 people in three groups. Far too few for a real, medium-sized effect.
Cohen
How big is the difference in real units?
failed. The headline never said how much. With about five people per group, no number means much.
Cohen
Were the measures fixed in advance?
failed. 18 measurements; whatever fell below 0.05 got reported.
Sagan
Has anyone else repeated it?
failed. No. It was a trap, set to see whether the media would notice.
Sagan
What else could explain it?
failed. Chance. The study was built on it.
Sagan
How extraordinary is the claim?
open. Not impossible. But a licence to eat sweets needs more than one study.
5 / 6
questions failed
Failing a question does not make a study worthless. Small pilots are useful as long as they are read as what they are: a pointer to where to look harder. The damage starts when the pointer becomes a certainty somewhere between lab, press office and feed.
Cohen discovered no new fact about the world. He changed how whole disciplines decide whether they have discovered anything at all. Sagan wrote the same rules down for everybody else. The next story that begins “according to a study” is already on its way. Probably tomorrow, with your coffee.